File:2005garlic.PNG
Original file (1,425 × 625 pixels, file size: 57 KB, MIME type: image/png)
Summary[edit]
| Summary | |
|---|---|
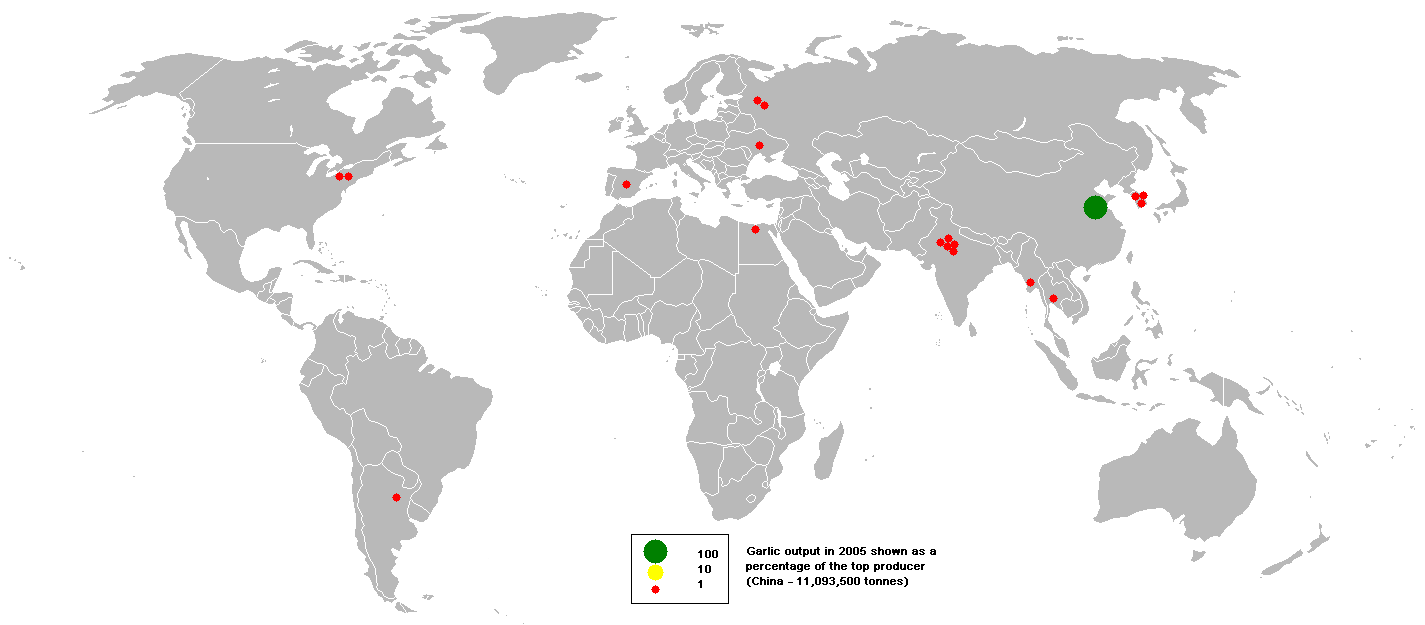
| Description | This bubble map shows the global distribution of garlic output in 2005 as a percentage of the top producer (China - 11,093,500 tonnes).
This map is consistent with incomplete set of data too as long as the top producer is known. It resolves the accessibility issues faced by colour-coded maps that may not be properly rendered in old computer screens. Data was extracted on 8th June 2007 from http://faostat.fao.org/site/336/DesktopDefault.aspx?PageID=336 Based on :Image:BlankMap-World.png |
| Source | Wikimedia Commons file page |
| Author | Anwar saadat at English Wikipedia |
| Permission | See original Commons license details. |
Licensing[edit]
Creative Commons Attribution-ShareAlike 3.0 Unported (CC BY-SA 3.0)
This file is licensed under the Creative Commons Attribution-ShareAlike 3.0 license.
Official license: CC BY-SA 3.0
License page: CC BY-SA 3.0
Original attribution and file history: Wikimedia Commons
File history
Click on a date/time to view the file as it appeared at that time.
| Date/Time | Thumbnail | Dimensions | User | Comment | |
|---|---|---|---|---|---|
| current | 02:10, 7 June 2026 | | 1,425 × 625 (57 KB) | Maintenance script (talk | contribs) | == Summary == Importing file |
You cannot overwrite this file.
File usage
The following page uses this file:
