File:2nd Order Damping Ratios.svg
From WikiMD's WELLNESSPEDIA

Size of this PNG preview of this SVG file: 720 × 460 pixels. Other resolution: 2,560 × 1,636 pixels.
Original file (SVG file, nominally 720 × 460 pixels, file size: 85 KB)
Summary[edit]
| Summary | |
|---|---|
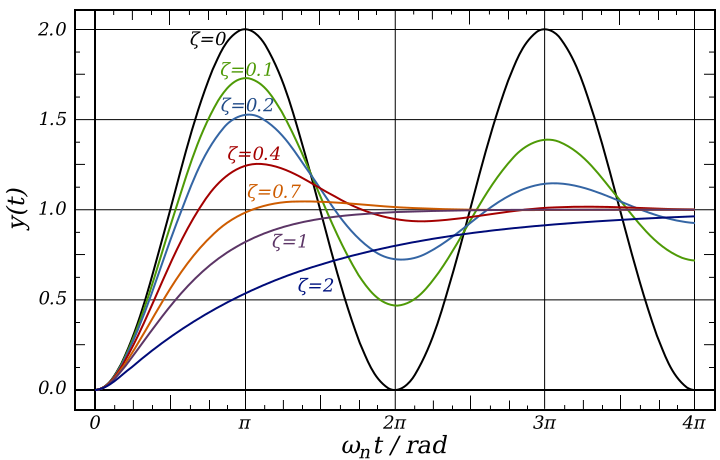
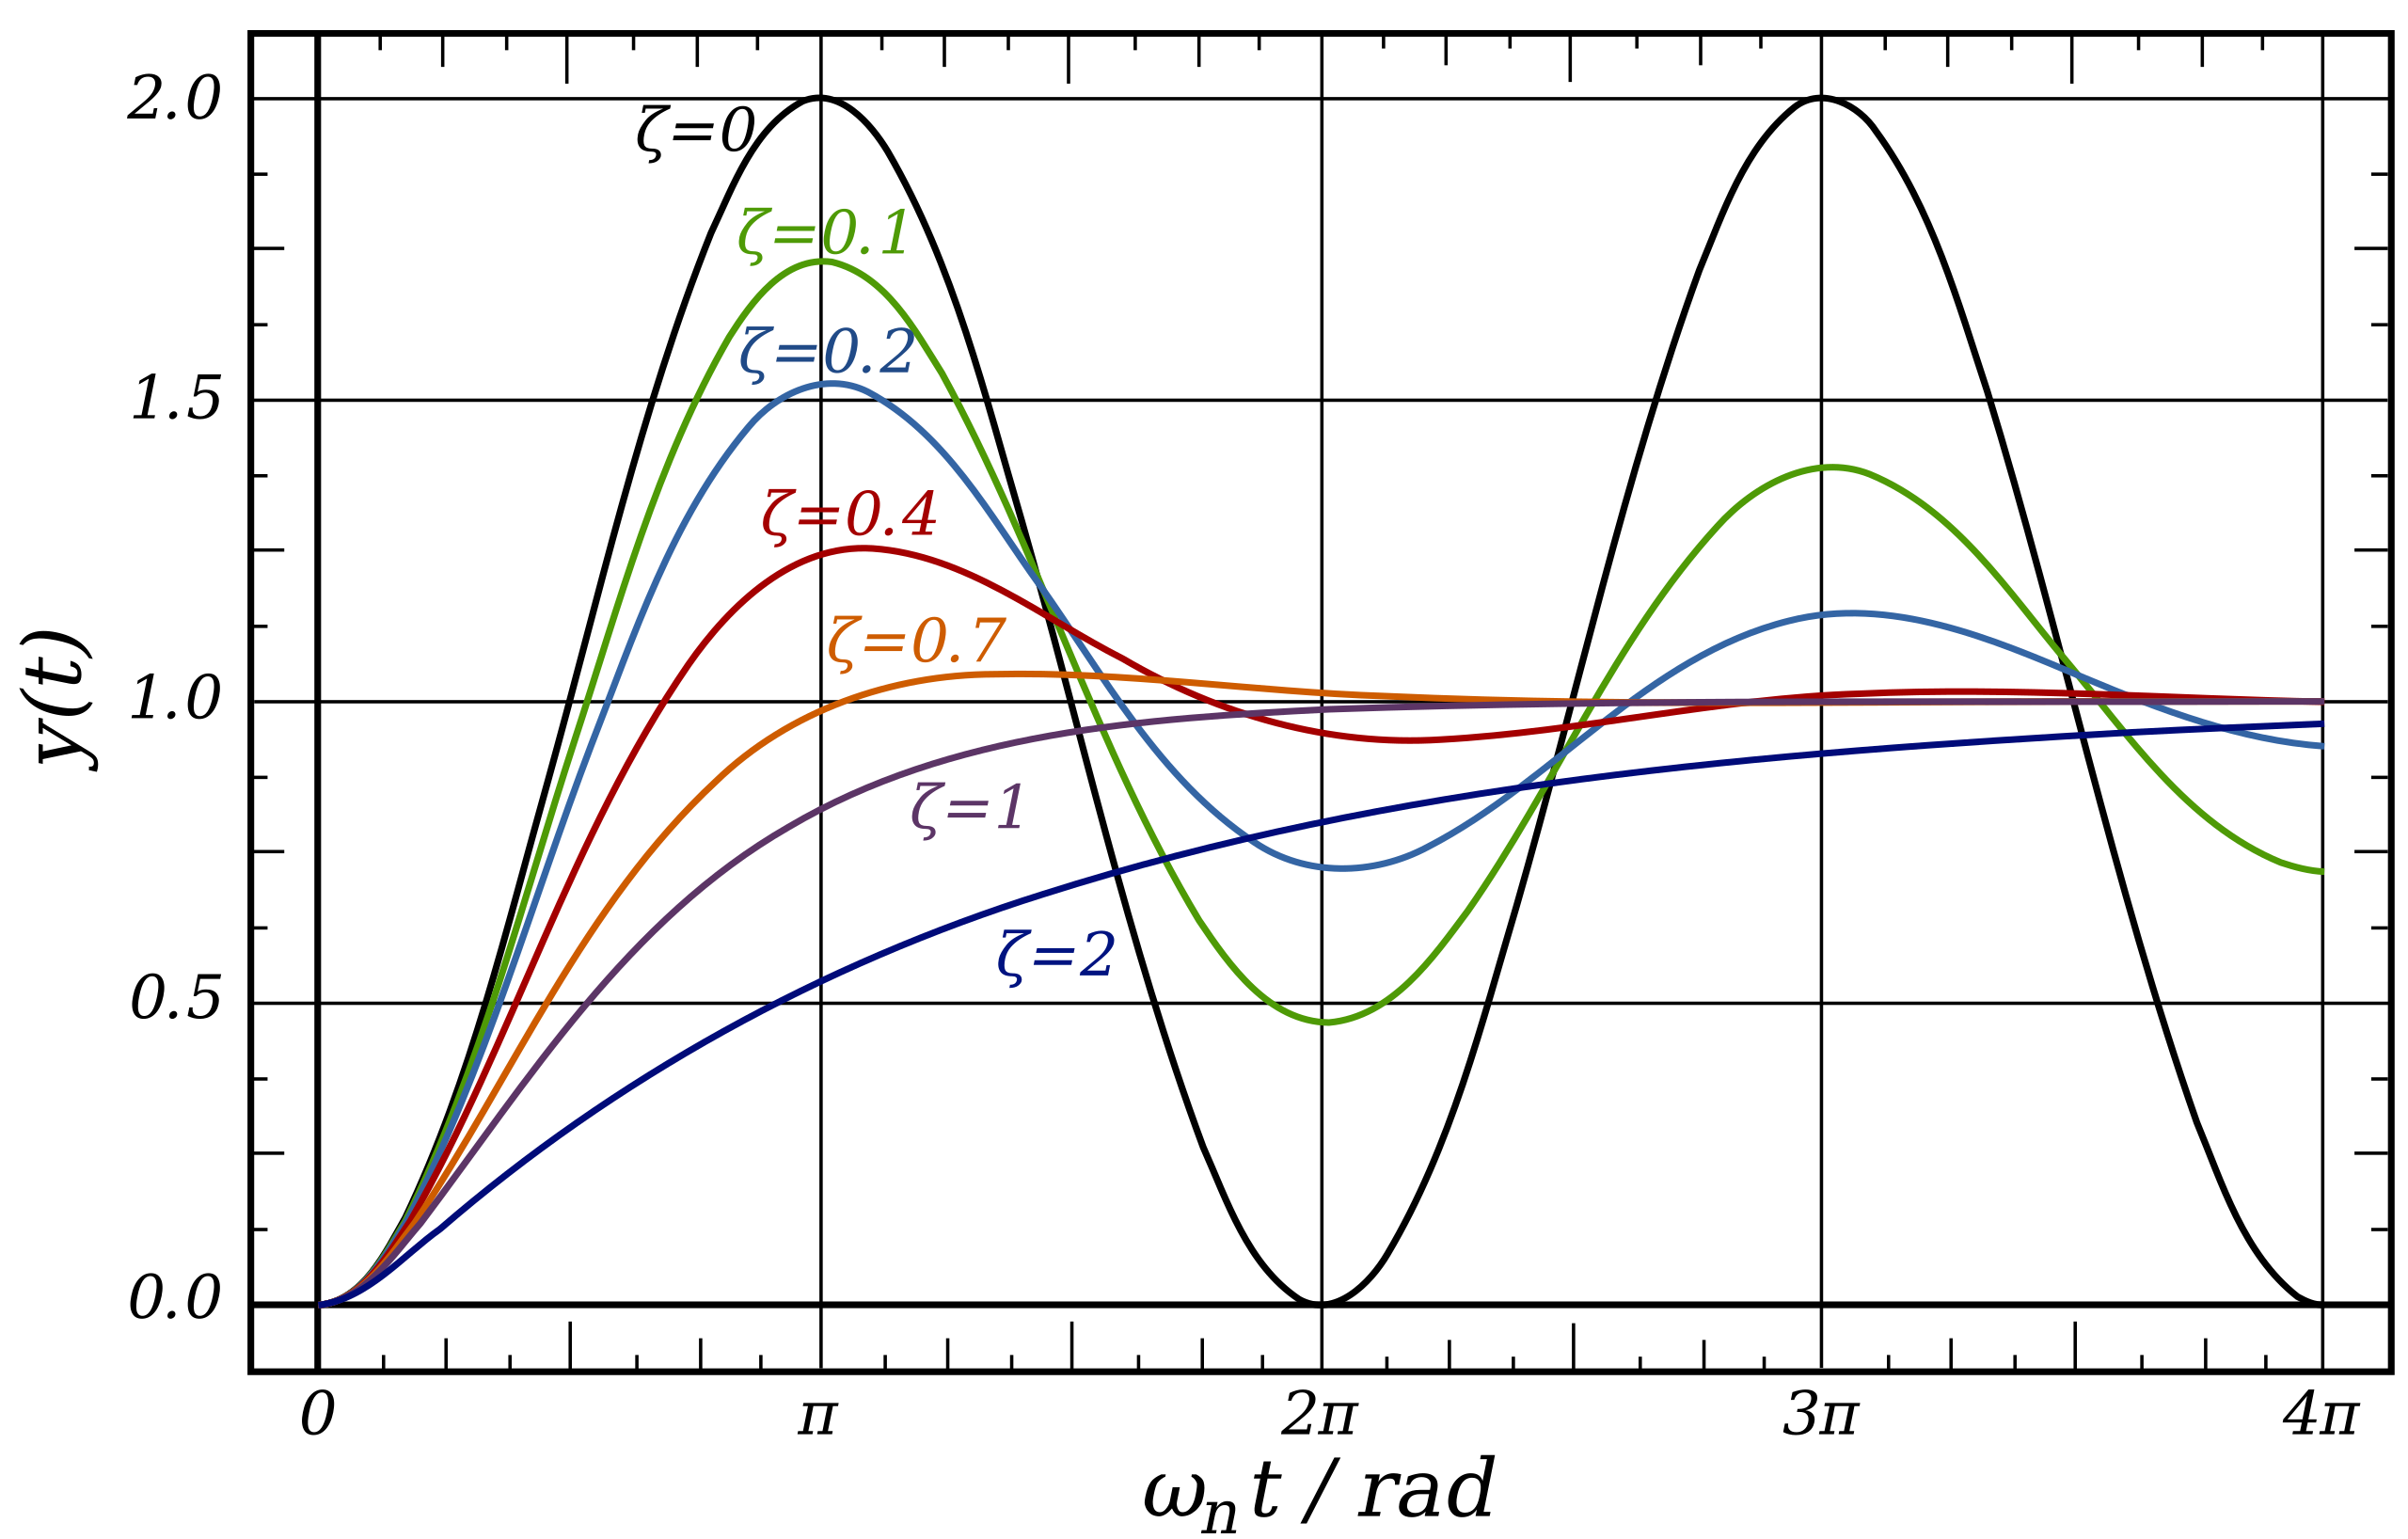
| Description | A graph of the time response of a second order system with various damping ratios. The horizontal axis is in radians, and represents the time multiplied by the natural frequency of the system. A range of damping ratios are depicted between 0 and 2. |
| Source | Wikimedia Commons file page |
| Author | Inductiveload |
| Permission | See original Commons license details. |
Licensing[edit]
Public Domain
This file is in the public domain and may be used without restriction.
Please see the linked source page for the original file history, attribution information, and licensing details.
Original attribution and file history: Wikimedia Commons
File history
Click on a date/time to view the file as it appeared at that time.
| Date/Time | Thumbnail | Dimensions | User | Comment | |
|---|---|---|---|---|---|
| current | 02:11, 7 June 2026 | | 720 × 460 (85 KB) | Maintenance script (talk | contribs) | == Summary == Importing file |
You cannot overwrite this file.
File usage
The following page uses this file:
