File:Ligne de grain.svg
From WikiMD's medical encyclopedia

Size of this PNG preview of this SVG file: 800 × 295 pixels. Other resolutions: 320 × 118 pixels | 640 × 236 pixels | 1,024 × 378 pixels | 1,280 × 472 pixels | 2,560 × 944 pixels | 1,264 × 466 pixels.
Original file (SVG file, nominally 1,264 × 466 pixels, file size: 69 KB)
Summary
| Description |
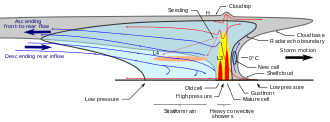
Français : Diagramme montrant une coupe verticale à travers une ligne de grain (orage) ou un système convectif de méso-échelle. On y voit la circulation de l'air et les zones de précipitations :
English: Conceptual vertical cross-section of a trailing stratiform Mesoscale convective storm flow structure:
|
| Date | |
| Source | Own work |
| Author | Whidou |
| Other versions |
This file was derived from: |
| SVG development | switch elements: all translations are stored in the same file. |
Licensing
I, the copyright holder of this work, hereby publish it under the following license:
This file is licensed under the Creative Commons Attribution-Share Alike 4.0 International license.
- You are free:
- to share – to copy, distribute and transmit the work
- to remix – to adapt the work
- Under the following conditions:
- attribution – You must give appropriate credit, provide a link to the license, and indicate if changes were made. You may do so in any reasonable manner, but not in any way that suggests the licensor endorses you or your use.
- share alike – If you remix, transform, or build upon the material, you must distribute your contributions under the same or compatible license as the original.
File history
Click on a date/time to view the file as it appeared at that time.
| Date/Time | Thumbnail | Dimensions | User | Comment | |
|---|---|---|---|---|---|
| current | 22:46, 13 March 2016 | 1,264 × 466 (69 KB) | Pierre cb | Text correction in English |
File usage
The following page uses this file: