File:Nightingale-mortality.jpg

Original file (6,996 × 3,826 pixels, file size: 5.32 MB, MIME type: image/jpeg)
Summary[edit]
| Summary | |
|---|---|
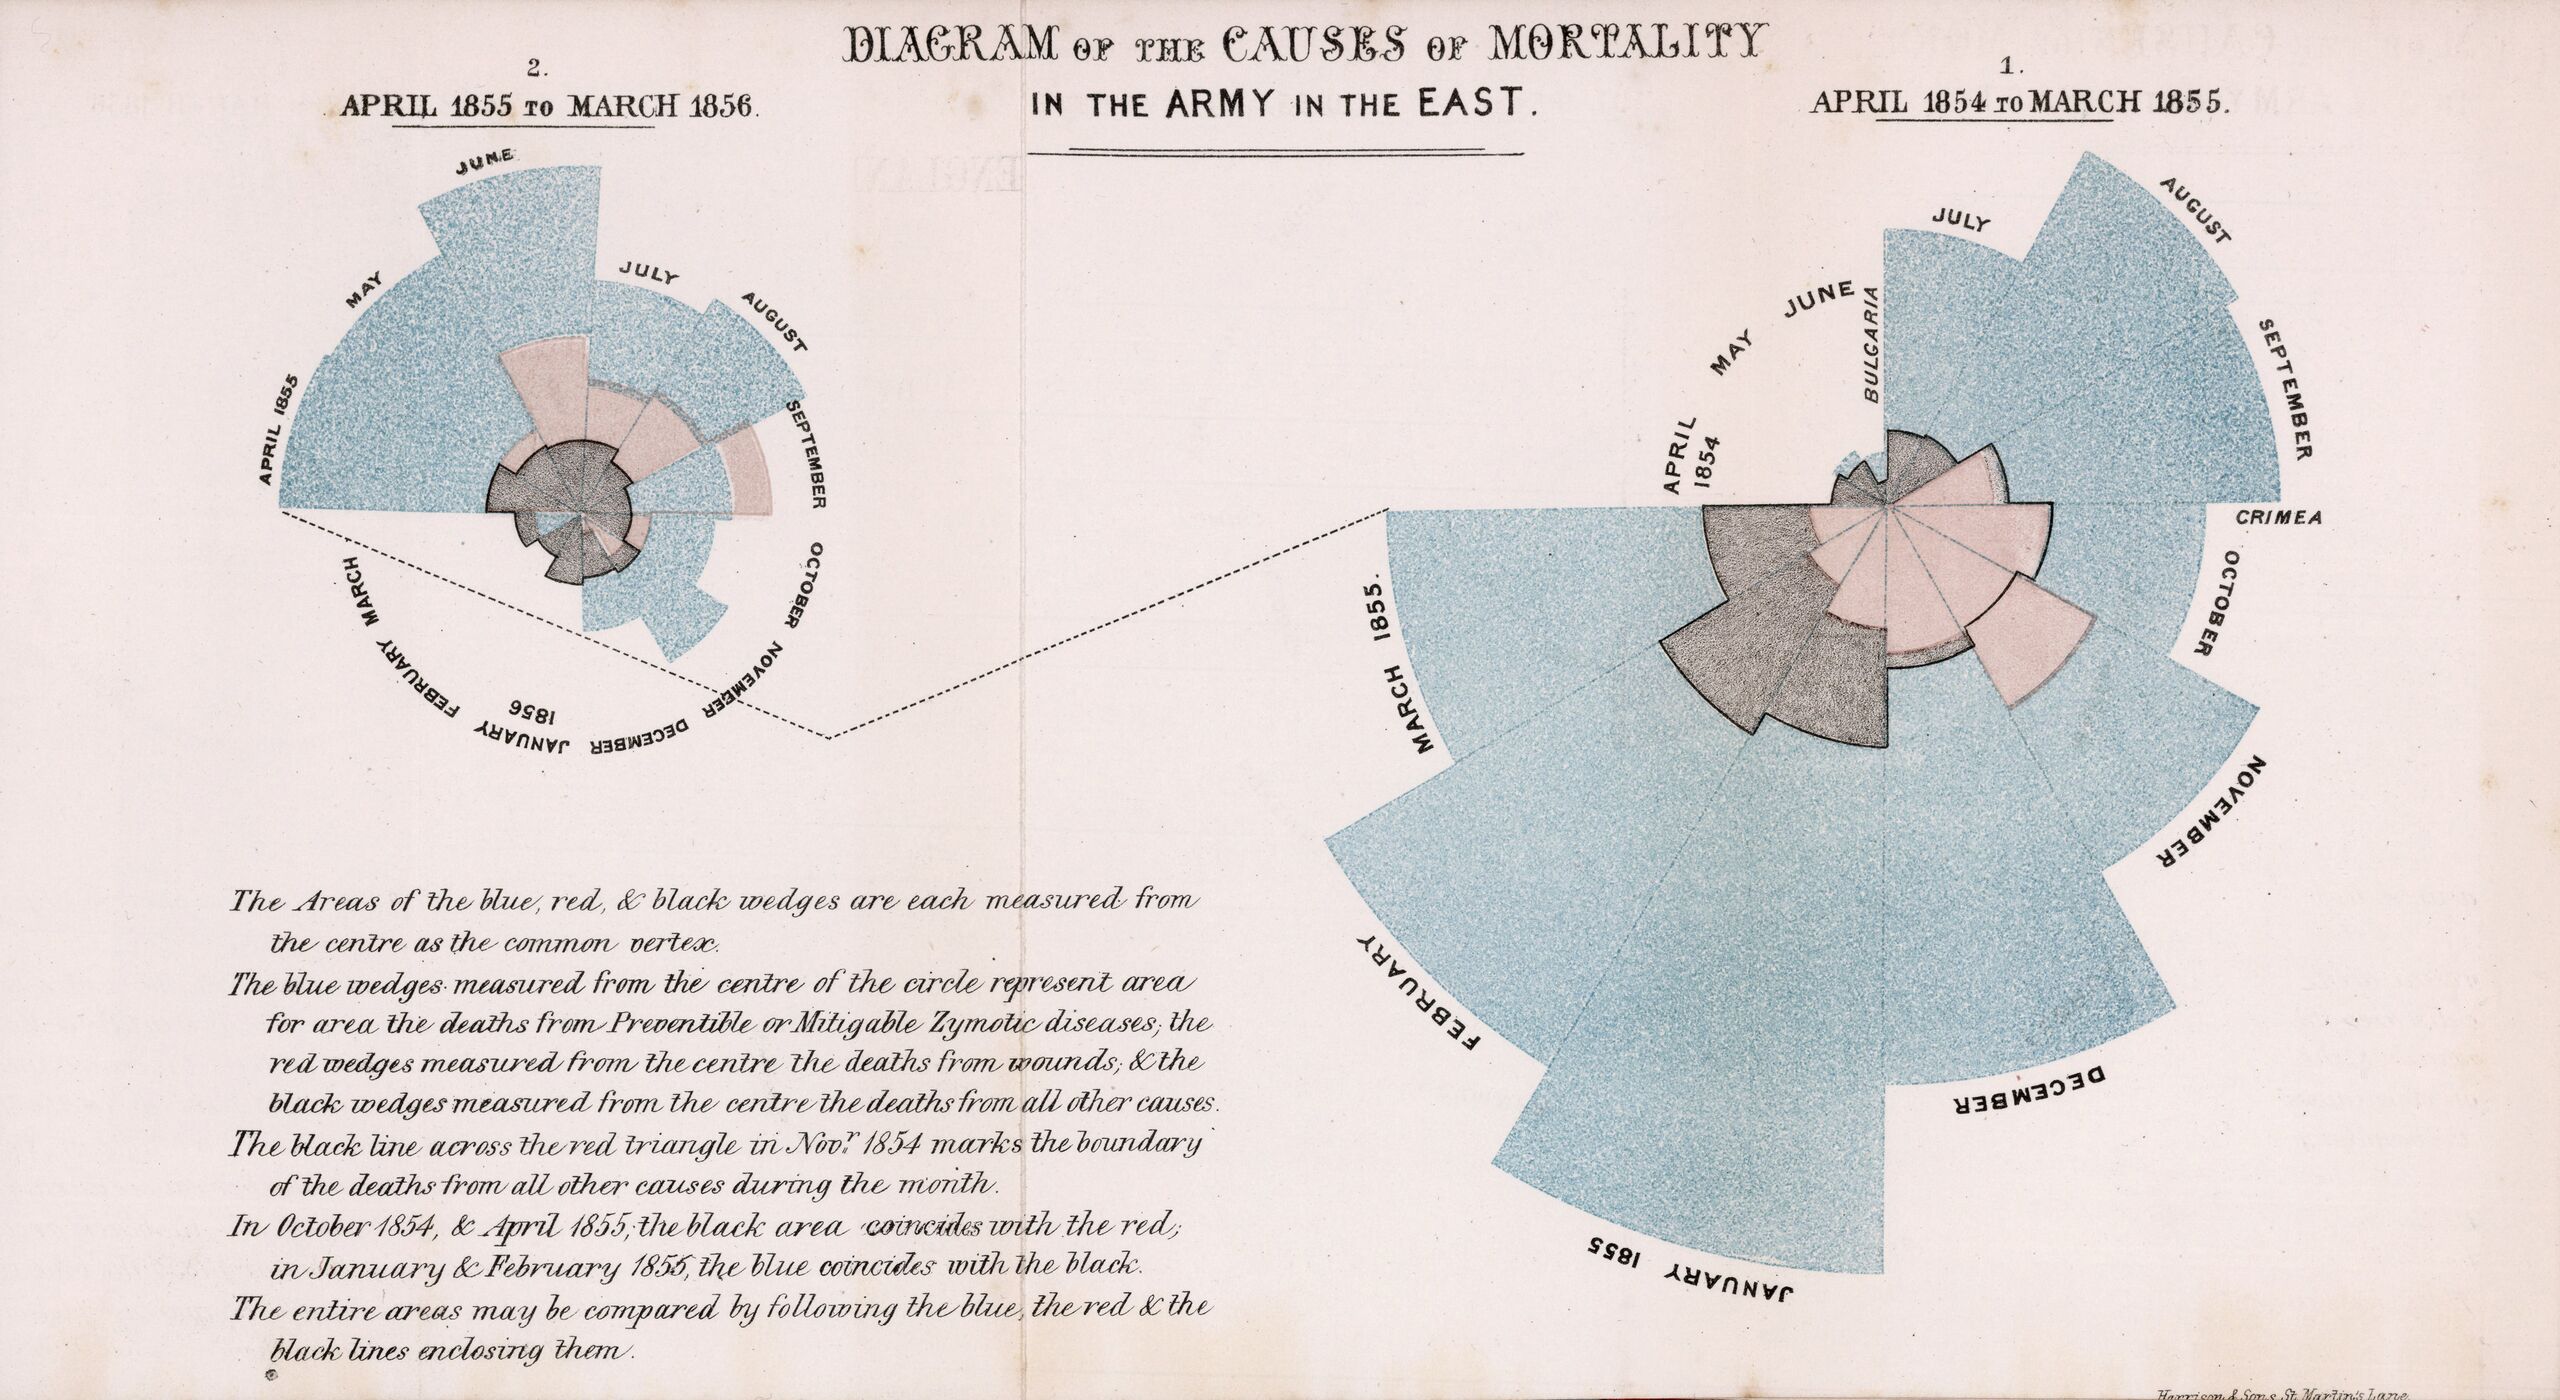
| Description | Example of polar area diagram by Florence Nightingale (1820–1910).
This "Diagram of the causes of mortality in the army in the East" was published in Notes on Matters Affecting the Health, Efficiency, and Hospital Administration of the British Army and sent to Queen Victoria in 1858. This graphic indicates the annual rate of mortality per 1,000 in each month that occurred from preventable diseases (in blue), those that were the results of wounds (in red), and those due to other causes (in black). The legend reads:
|
| Source | Wikimedia Commons file page |
| Author | Florence Nightingale |
| Permission | See original Commons license details. |
Licensing[edit]
Public Domain
This file is in the public domain and may be used without restriction.
Please see the linked source page for the original file history, attribution information, and licensing details.
Original attribution and file history: Wikimedia Commons
File history
Click on a date/time to view the file as it appeared at that time.
| Date/Time | Thumbnail | Dimensions | User | Comment | |
|---|---|---|---|---|---|
| current | 22:28, 8 June 2026 | | 6,996 × 3,826 (5.32 MB) | Maintenance script (talk | contribs) | == Summary == Importing file |
You cannot overwrite this file.
File usage
The following page uses this file:
