File:P300 vs oddballProbability.svg

Original file (SVG file, nominally 450 × 395 pixels, file size: 257 KB)
Summary[edit]
| Summary | |
|---|---|
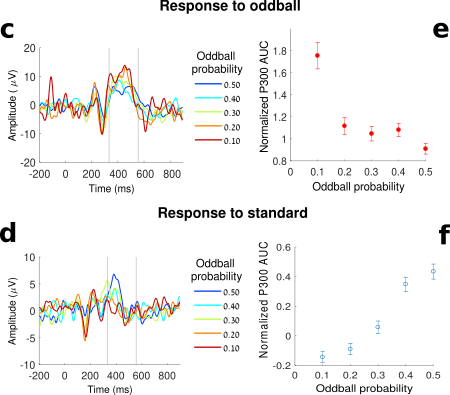
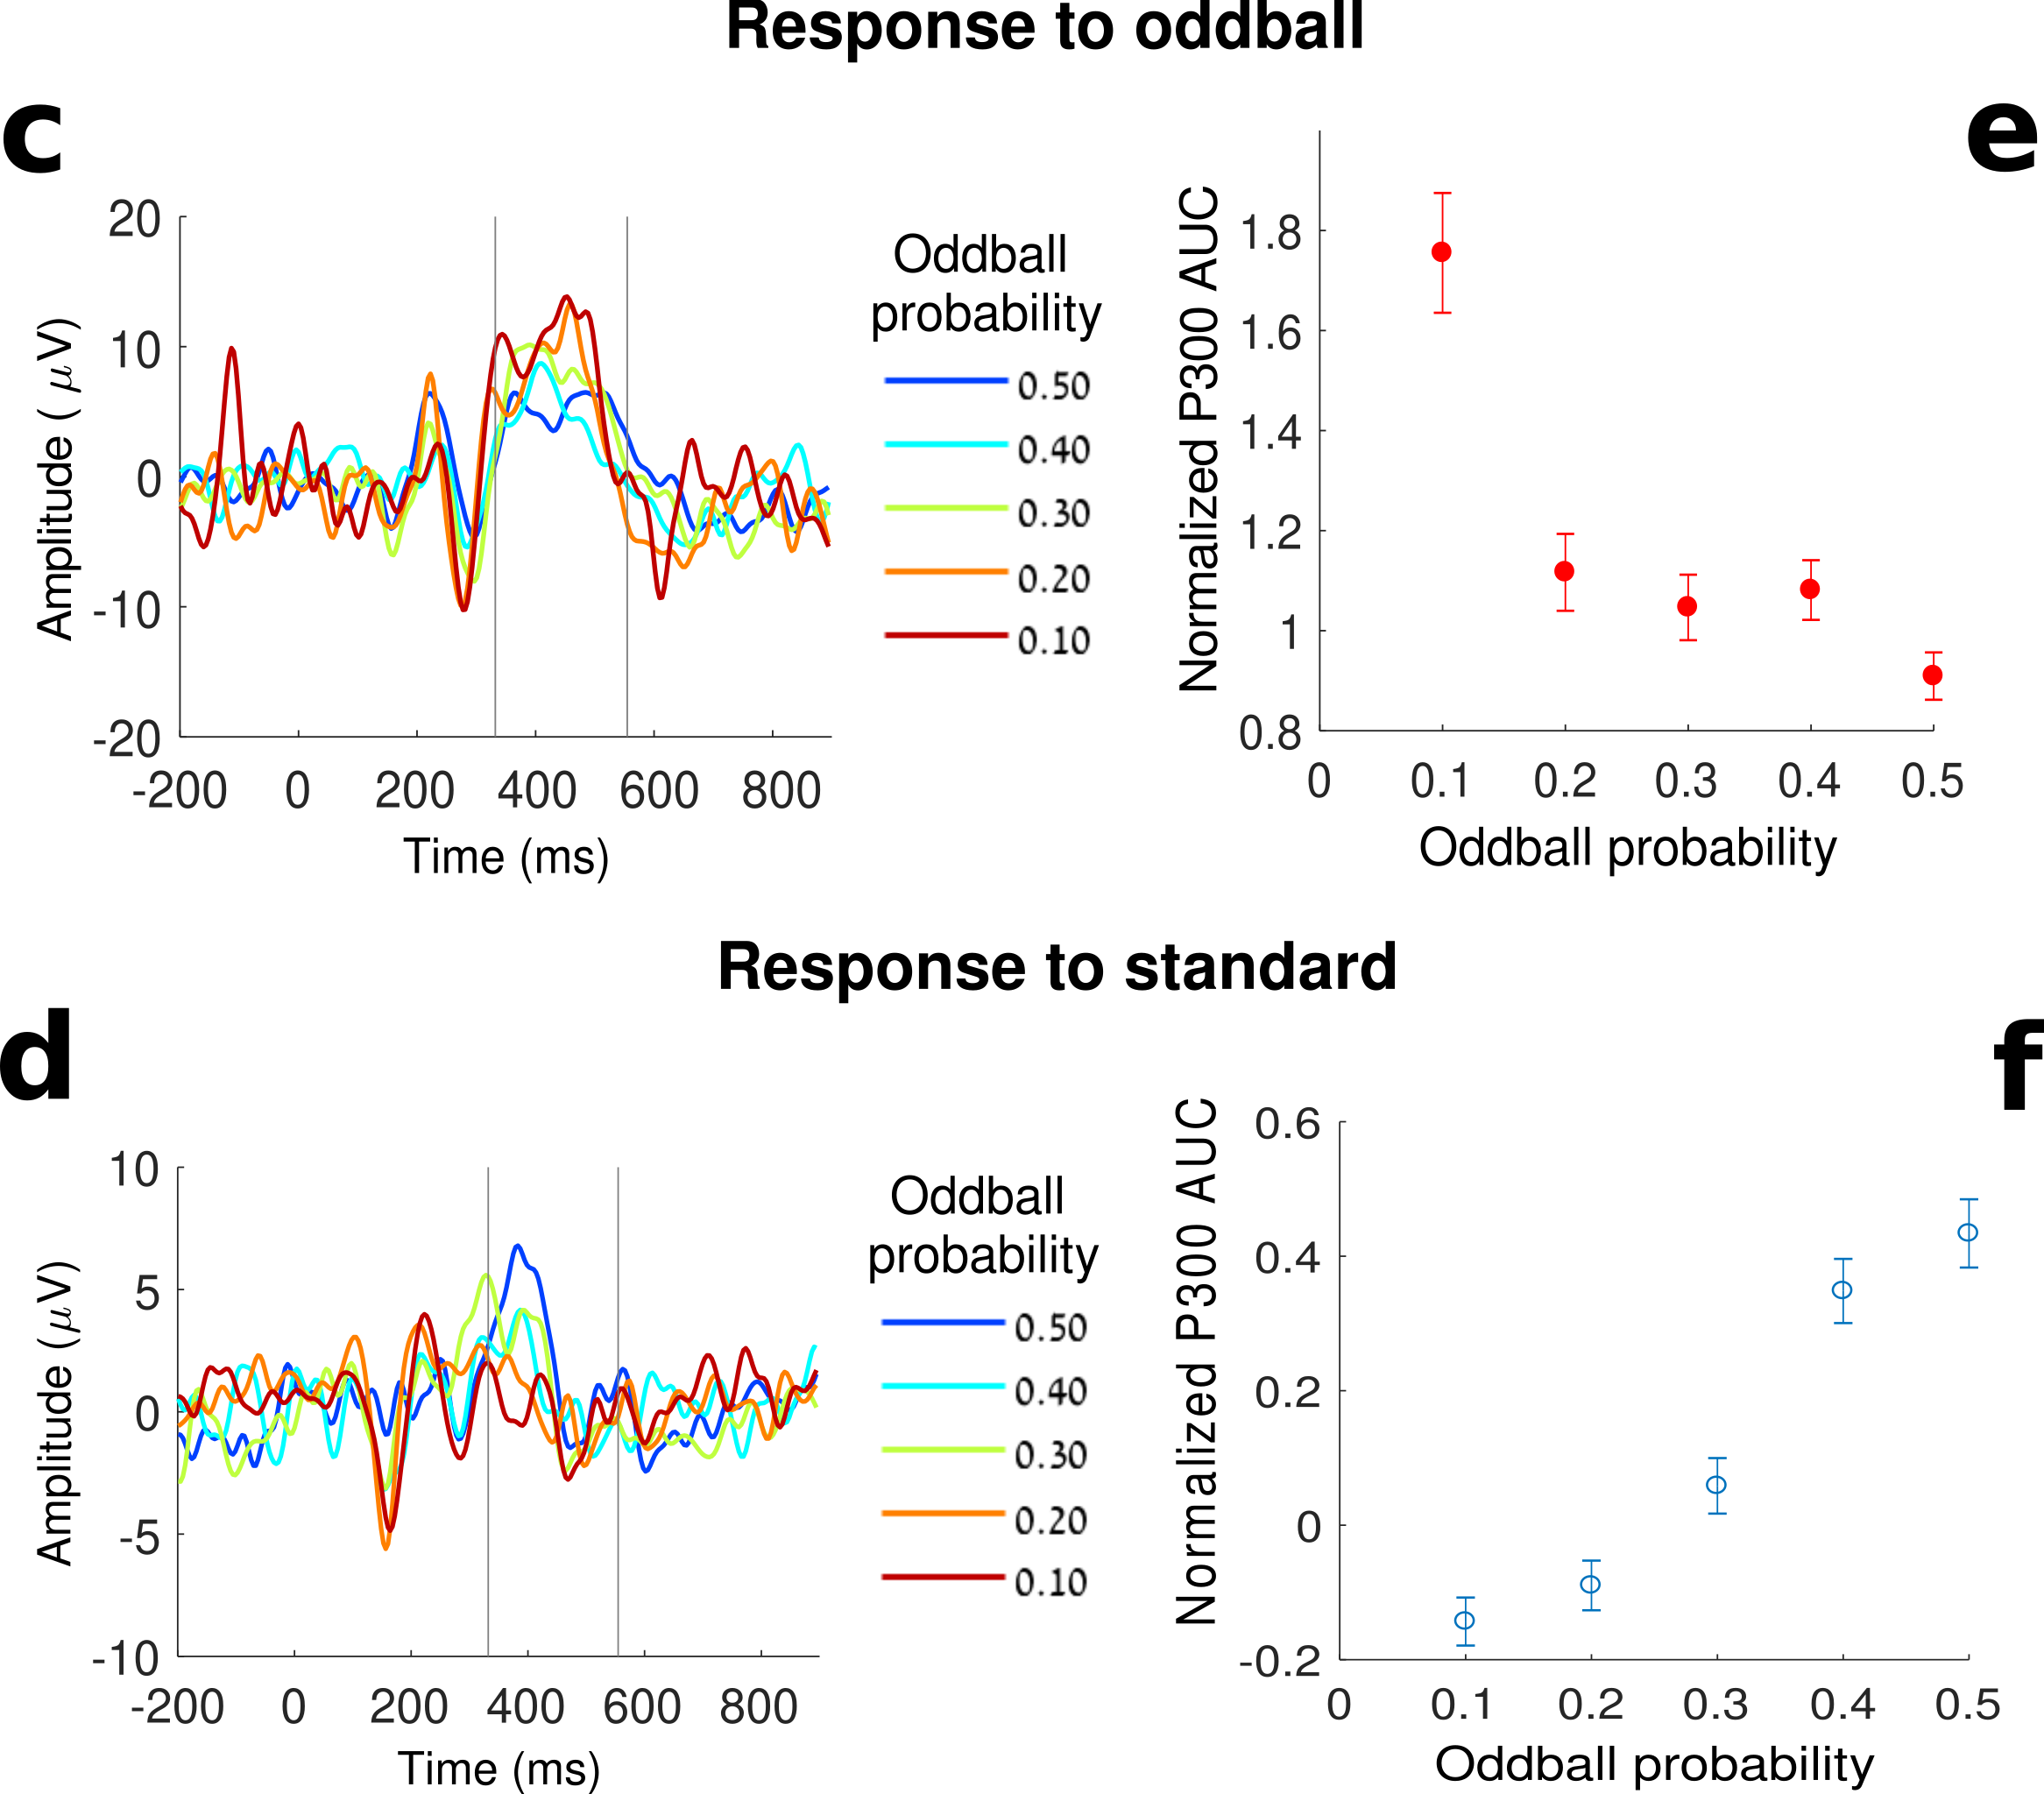
| Description | (c) The average ERP response of all oddball trials in each block of the experiment is shown color-coded for a representative subject. The oddball probability (OP) of each block is shown in the legend.
(d) The average trace of all standard trials in each block is shown color-coded (as in (c)). (e), The mean normalized P300 area-under-the-curve (AUC, for the exact definition see the original paper) of all oddball trials in each block averaged over all subjects are plotted as a function of the corresponding oddball probability of that block. The error bars indicate the standard error of the mean (SEM). (f) The same as (e) for standard trials. |
| Source | Wikimedia Commons file page |
| Author | Hadarl |
| Permission | See original Commons license details. |
Licensing[edit]
Creative Commons Attribution-ShareAlike 4.0 International (CC BY-SA 4.0)
This file is licensed under the Creative Commons Attribution-ShareAlike 4.0 International license.
You are free to:
- Share — copy and redistribute the material.
- Adapt — remix, transform, and build upon the material.
Under the following conditions:
- Attribution — appropriate credit must be given.
- ShareAlike — derivative works must be distributed under the same license.
Official license: CC BY-SA 4.0
License page: CC BY-SA 4.0
Original attribution and file history: Wikimedia Commons
File history
Click on a date/time to view the file as it appeared at that time.
| Date/Time | Thumbnail | Dimensions | User | Comment | |
|---|---|---|---|---|---|
| current | 03:25, 5 June 2026 | | 450 × 395 (257 KB) | Maintenance script (talk | contribs) | == Summary == Importing file |
You cannot overwrite this file.
File usage
The following file is a duplicate of this file (more details):
- File:P300 vs oddballProbability.svg from Wikimedia Commons
The following 2 pages use this file:
