File:Rate of Protein Structure Determination-2014.png
Original file (3,500 × 2,500 pixels, file size: 228 KB, MIME type: image/png)
Summary
Licensing
- You are free:
- to share – to copy, distribute and transmit the work
- to remix – to adapt the work
- Under the following conditions:
- attribution – You must give appropriate credit, provide a link to the license, and indicate if changes were made. You may do so in any reasonable manner, but not in any way that suggests the licensor endorses you or your use.
- share alike – If you remix, transform, or build upon the material, you must distribute your contributions under the same or compatible license as the original.
Source code
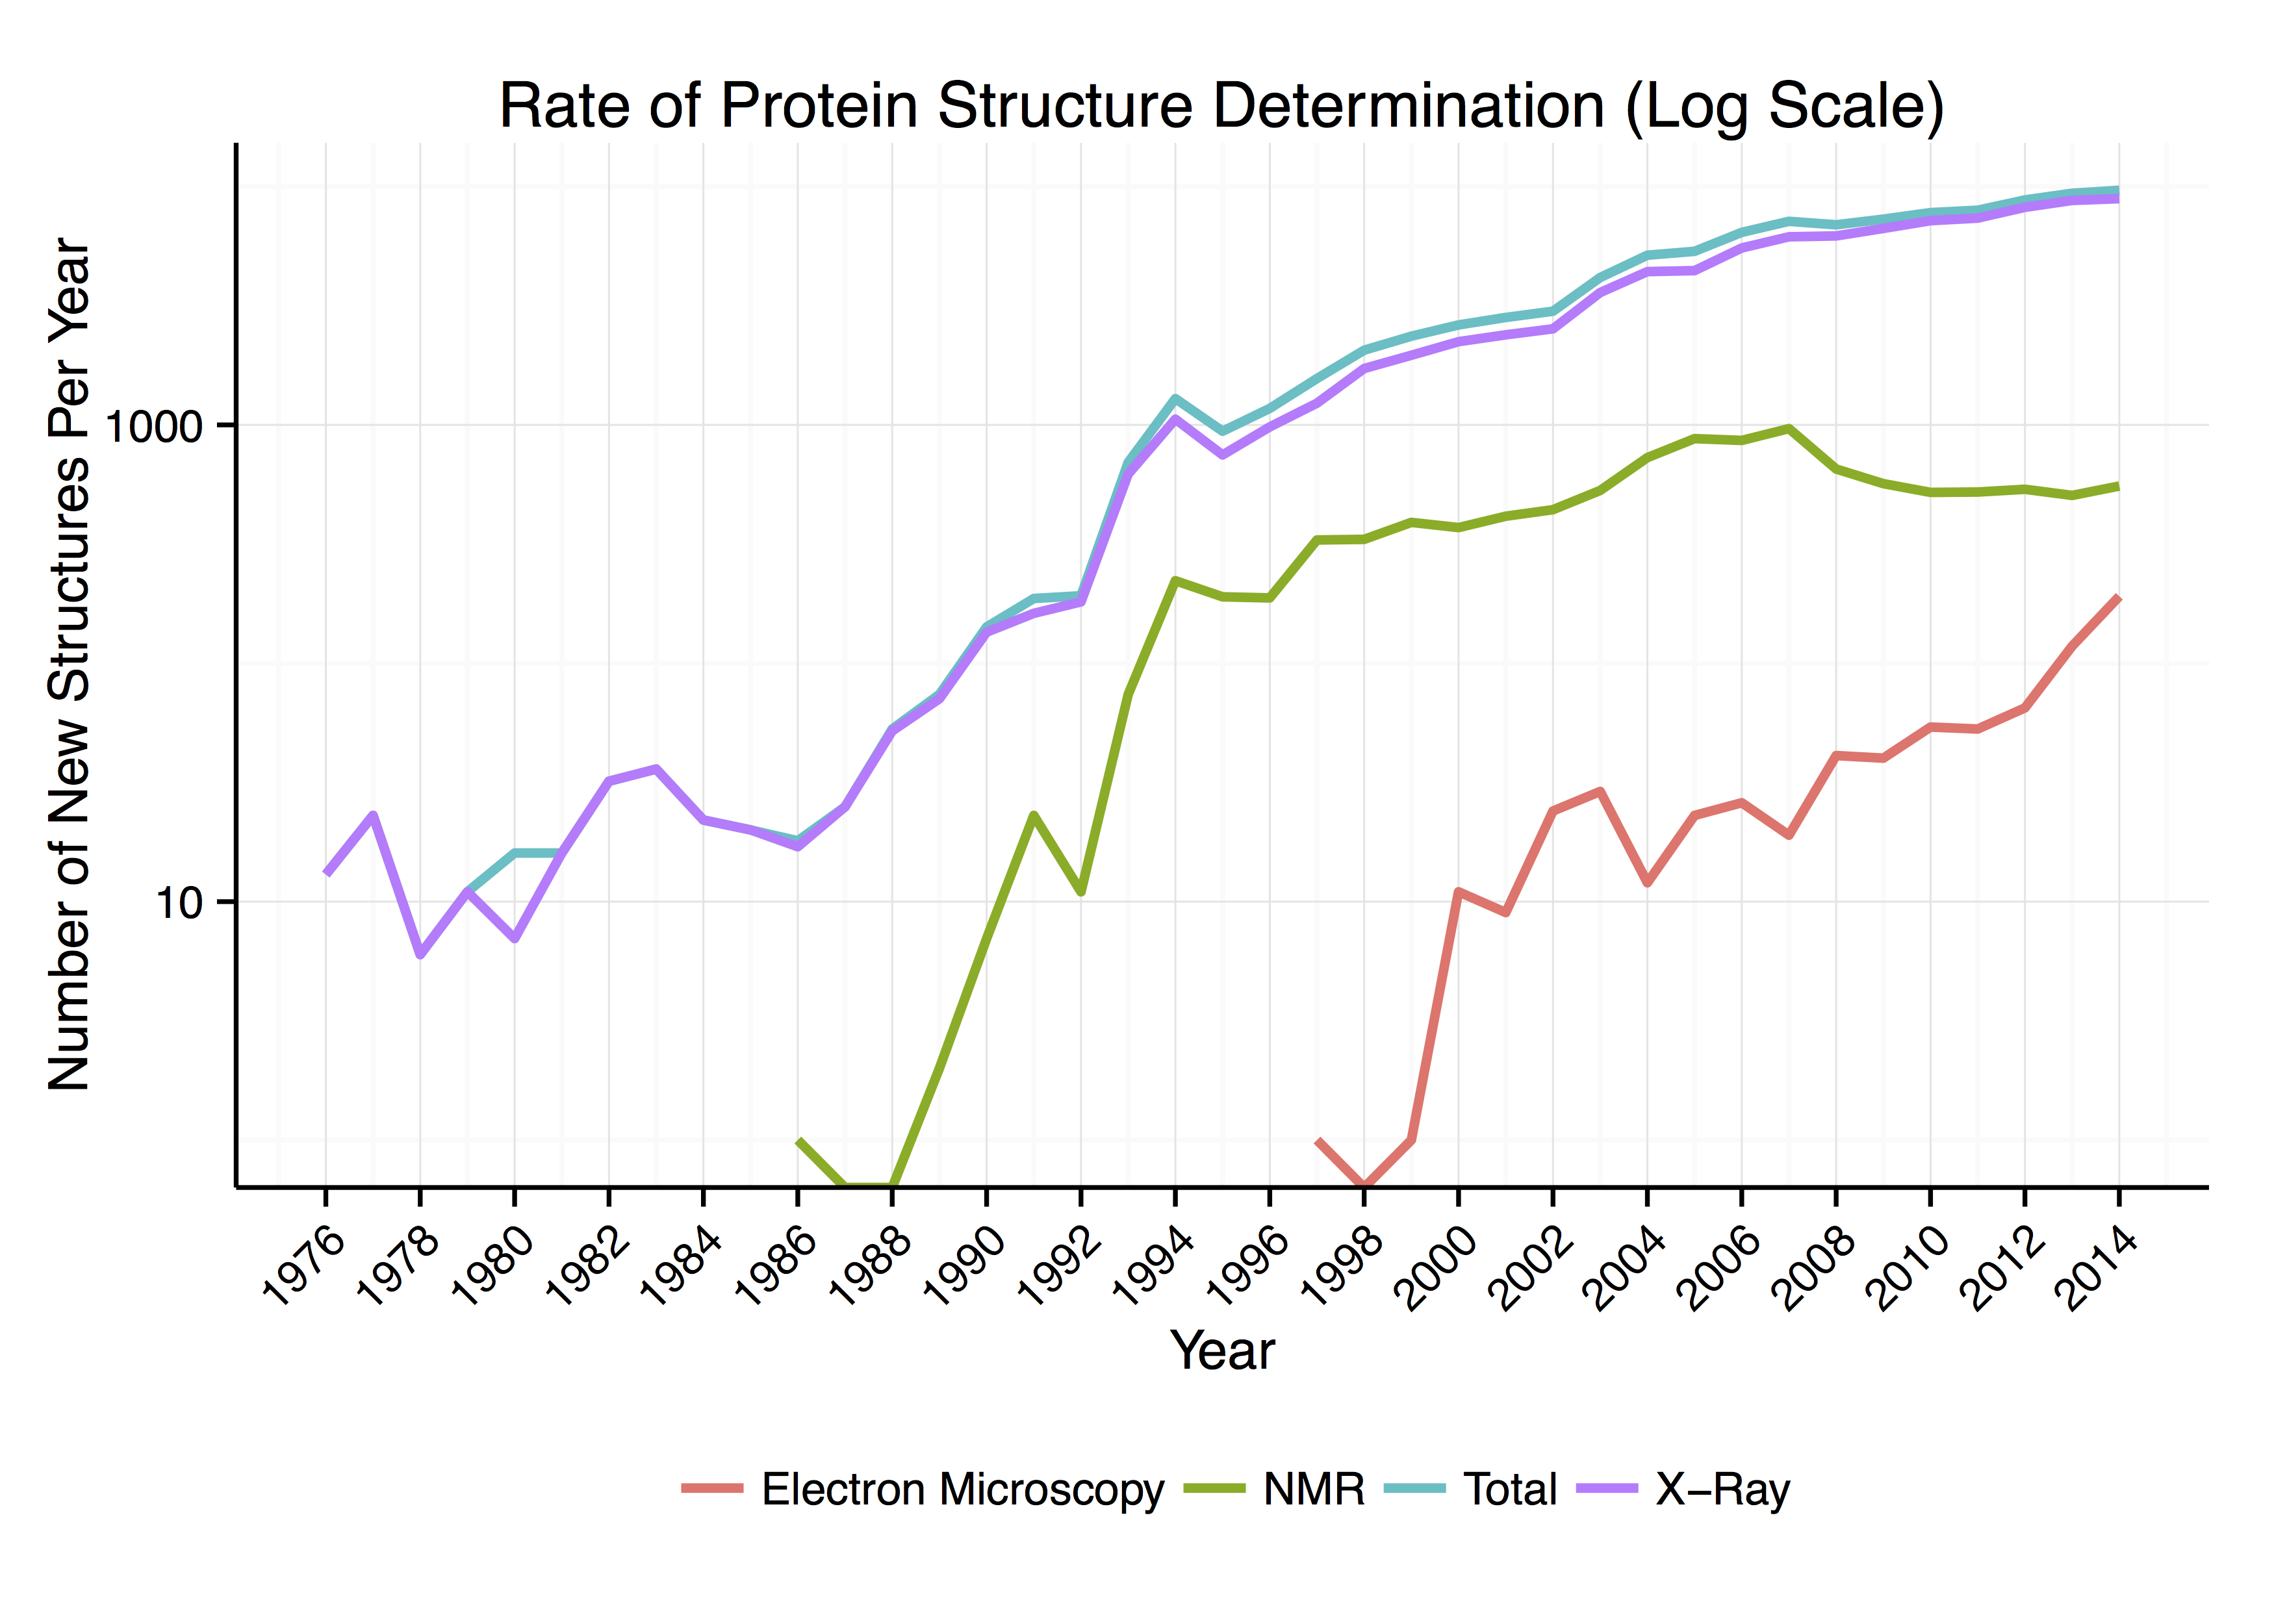
<source lang='rsplus'> PDB <- structure(list(Year = c(2014L, 2013L, 2012L, 2011L, 2010L, 2009L, 2008L, 2007L, 2006L, 2005L, 2004L, 2003L, 2002L, 2001L, 2000L, 1999L, 1998L, 1997L, 1996L, 1995L, 1994L, 1993L, 1992L, 1991L, 1990L, 1989L, 1988L, 1987L, 1986L, 1985L, 1984L, 1983L, 1982L, 1981L, 1980L, 1979L, 1978L, 1977L, 1976L, 2014L, 2013L, 2012L, 2011L, 2010L, 2009L, 2008L, 2007L, 2006L, 2005L, 2004L, 2003L, 2002L, 2001L, 2000L, 1999L, 1998L, 1997L, 1996L, 1995L, 1994L, 1993L, 1992L, 1991L, 1990L, 1989L, 1988L, 1987L, 1986L, 1985L, 1984L, 1983L, 1982L, 1981L, 1980L, 1979L, 1978L, 1977L, 1976L, 2014L, 2013L, 2012L, 2011L, 2010L, 2009L, 2008L, 2007L, 2006L, 2005L, 2004L, 2003L, 2002L, 2001L, 2000L, 1999L, 1998L, 1997L, 2014L, 2013L, 2012L, 2011L, 2010L, 2009L, 2008L, 2007L, 2006L, 2005L, 2004L, 2003L, 2002L, 2001L, 2000L, 1999L, 1998L, 1997L, 1996L, 1995L, 1994L, 1993L, 1992L, 1991L, 1990L, 1989L, 1988L, 1987L, 1986L), Yearly = c(9645L, 9373L, 8787L, 7955L, 7772L, 7297L, 6911L, 7147L, 6422L, 5348L, 5152L, 4153L, 2999L, 2823L, 2627L, 2356L, 2058L, 1565L, 1173L, 941L, 1289L, 696L, 192L, 187L, 142L, 74L, 53L, 25L, 18L, 20L, 22L, 36L, 32L, 16L, 16L, 11L, 6L, 23L, 13L, 8893L, 8743L, 8179L, 7372L, 7189L, 6671L, 6206L, 6154L, 5523L, 4438L, 4397L, 3592L, 2530L, 2387L, 2234L, 1960L, 1724L, 1234L, 981L, 748L, 1057L, 622L, 181L, 162L, 135L, 71L, 52L, 25L, 17L, 20L, 22L, 36L, 32L, 16L, 7L, 11L, 6L, 23L, 13L, 191L, 118L, 65L, 53L, 54L, 40L, 41L, 19L, 26L, 23L, 12L, 29L, 24L, 9L, 11L, 1L, 0L, 1L, 554L, 506L, 537L, 523L, 521L, 567L, 653L, 965L, 861L, 876L, 729L, 531L, 441L, 414L, 371L, 390L, 331L, 329L, 188L, 190L, 222L, 74L, 11L, 23L, 7L, 2L, 0L, 0L, 1L), Category = structure(c(3L, 3L, 3L, 3L, 3L, 3L, 3L, 3L, 3L, 3L, 3L, 3L, 3L, 3L, 3L, 3L, 3L, 3L, 3L, 3L, 3L, 3L, 3L, 3L, 3L, 3L, 3L, 3L, 3L, 3L, 3L, 3L, 3L, 3L, 3L, 3L, 3L, 3L, 3L, 4L, 4L, 4L, 4L, 4L, 4L, 4L, 4L, 4L, 4L, 4L, 4L, 4L, 4L, 4L, 4L, 4L, 4L, 4L, 4L, 4L, 4L, 4L, 4L, 4L, 4L, 4L, 4L, 4L, 4L, 4L, 4L, 4L, 4L, 4L, 4L, 4L, 4L, 4L, 1L, 1L, 1L, 1L, 1L, 1L, 1L, 1L, 1L, 1L, 1L, 1L, 1L, 1L, 1L, 1L, 1L, 1L, 2L, 2L, 2L, 2L, 2L, 2L, 2L, 2L, 2L, 2L, 2L, 2L, 2L, 2L, 2L, 2L, 2L, 2L, 2L, 2L, 2L, 2L, 2L, 2L, 2L, 2L, 2L, 2L, 2L), .Label = c("Electron Microscopy", "NMR", "Total", "X-Ray"), class = "factor")), .Names = c("Year", "Yearly", "Category"), class = "data.frame", row.names = c(NA, -125L))
library(ggplot2)
ggplot(data=PDB,aes(x=Year, y=Yearly, colour=Category)) + geom_line(size=1) + labs(x="Year", y="Number of New Structures Per Year", title="Rate of Protein Structure Determination (Log Scale)", color="") + scale_x_continuous(breaks=c(seq(from=1976,to=2014,by=2))) + theme_minimal() + theme(legend.position="bottom",axis.text.x = element_text(angle=45,hjust=1),axis.line = element_line(size = 0.5, linetype = "solid",colour = "black")) + scale_y_log10()
ggsave(file="PDB.pdf", width=7, height=5) </syntaxhighlight>
File history
Click on a date/time to view the file as it appeared at that time.
| Date/Time | Thumbnail | Dimensions | User | Comment | |
|---|---|---|---|---|---|
| current | 20:19, 26 September 2016 | | 3,500 × 2,500 (228 KB) | wikimediacommons>Cmdrjameson | Compressed with pngout. Reduced by 207kB (47% decrease). |
File usage
The following page uses this file:
